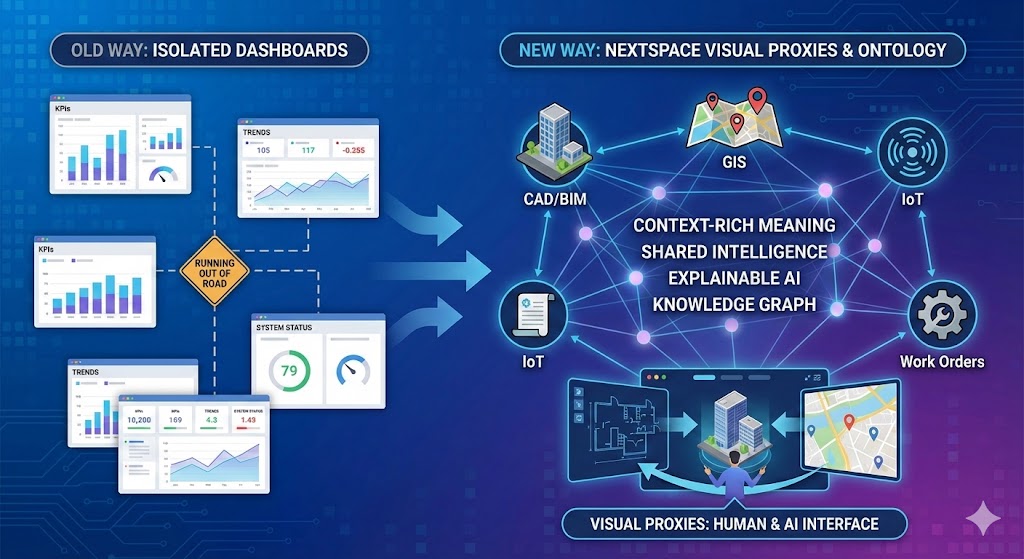
For decades, business intelligence dashboards have been the default way organisations visualise operational data. A KPI here, a trendline there – dashboards promise clarity. But in the complex world of infrastructure, where systems are interdependent and context matters as much as numbers, traditional dashboards are running out of road.
Dashboards slice information into static views. They aggregate metrics, plot charts, and spotlight exceptions. But they typically live outside the reality they describe. Data remains fragmented across silos – engineering, spatial, maintenance, and IoT systems each speak their own language – and dashboards merely act as superficial lenses on top of that fractured landscape. This approach leaves users – and increasingly, artificial intelligence – to stitch together meaning that the data itself never encoded in the first place.
It’s time for something more connected, more expressive — and fundamentally different.
From Isolated Metrics to Context-Rich Meaning
At Nextspace, we believe the future of infrastructure data isn’t about dashboards with more filters or prettier charts. It’s about ontology – a semantic model that captures what your data represents, how pieces relate, and why these relationships matter in real-world context.
Traditional dashboards reflect values. Ontologies capture meaning.
Where dashboards treat each data source as a separate stream, ontology-based models unify every data type – CAD/BIM geometry, GIS maps, sensor streams, work orders, financial records and documents – into a single, living model of the infrastructure. Each entity becomes a node in a knowledge graph with defined relationships, behaviours, identity and history. This turns static data into a dynamic, contextualised foundation for understanding the whole system – not just parts of it.
This isn’t just semantics; it’s practical. Without shared context, dashboards can be misleading: a pump “overheating” in one system might be normal under peak load conditions in another, yet dashboards will still flag an alert without insight into the why. Ontology aligns meanings, resolves identities, and situates every measurement within the full story of the asset’s life – including location, function, design, dependencies, and past performance. Context comes before insight, not after it.
Visual Proxies: The Human & AI Interface to Reality
Contrast this with ontology-based visual proxies, a Nextspace hallmark. Rather than static panels of numbers, visual proxies are contextual windows into the knowledge graph – not separate views but attributes of the data itself.
These proxies let users:
Navigate 2D schematics alongside linked 3D and GIS views
Jump from a map to the document that defines an asset
Animate systems over time to explore historical performance
Share annotations and insights across roles
Importantly, the same contextual model serves machines and humans alike.
AI doesn’t live in dashboards. It lives in semantic understanding. Without context, large language models and analytics engines guess at meaning and hallucinate. With ontology, they anchor reasoning in reality – relationships, constraints, dependencies and temporal history – and produce insights that make sense in the real world.
Beyond Visualization: Shared Intelligence
The shift is not just visual – it’s cognitive.
Dashboards present symptoms. Ontology reveals mechanisms. When infrastructure operators can contextualise data at the source, teams communicate better, simulations become meaningful, forecasts become reliable, and AI becomes genuinely useful.
This leads to outcomes no dashboard ever delivered:
Explainable AI, where analytics trace back to defined relationships and entities
Comprehensive simulations that respect physical and temporal context
Faster decision cycles because insights come from a shared model – not fragmented guesses
In other words, replacing dashboards with context-rich visual proxies driven by ontology is not about losing something familiar – it’s about gaining something far more powerful.
The Future Isn’t Metrics – It’s Meaning
Infrastructure operators no longer need isolated charts. They need a shared world model that both humans and machines can inhabit – a knowledge twin that reveals not just what is happening, but why it matters.
As AI becomes embedded in everyday operations, the real differentiator won’t be who has the most dashboards, but who has the deepest understanding of their data – rooted in context, not just numbers.
The end of dashboards isn’t a step backwards. It’s a leap forward into a world where data finally makes sense.